Baseball Stats, Model Cards, and Forecasting Performance

TL;DR: A baseball game in Atlanta led to some ideas for visual scorecards, performance-above-replacement metrics, and effort-normalised evaluation that seem useful/interesting.

I have been in Atlanta for the last few days teaching at SISMID (course materials with some really good (not biased) new forecasting content and other tweaks) with Nick Reich and Thomas Robacker. It was a lot of fun even if Atlanta is about 300% too hot for me.

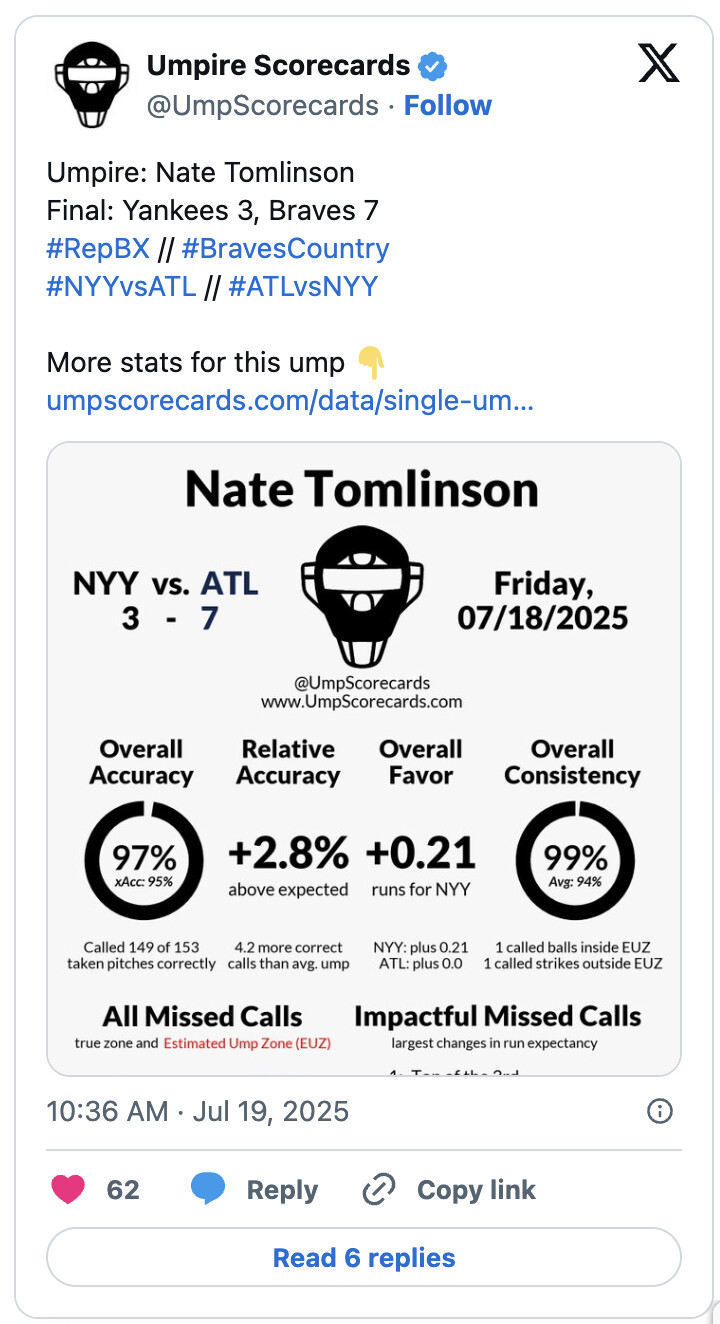
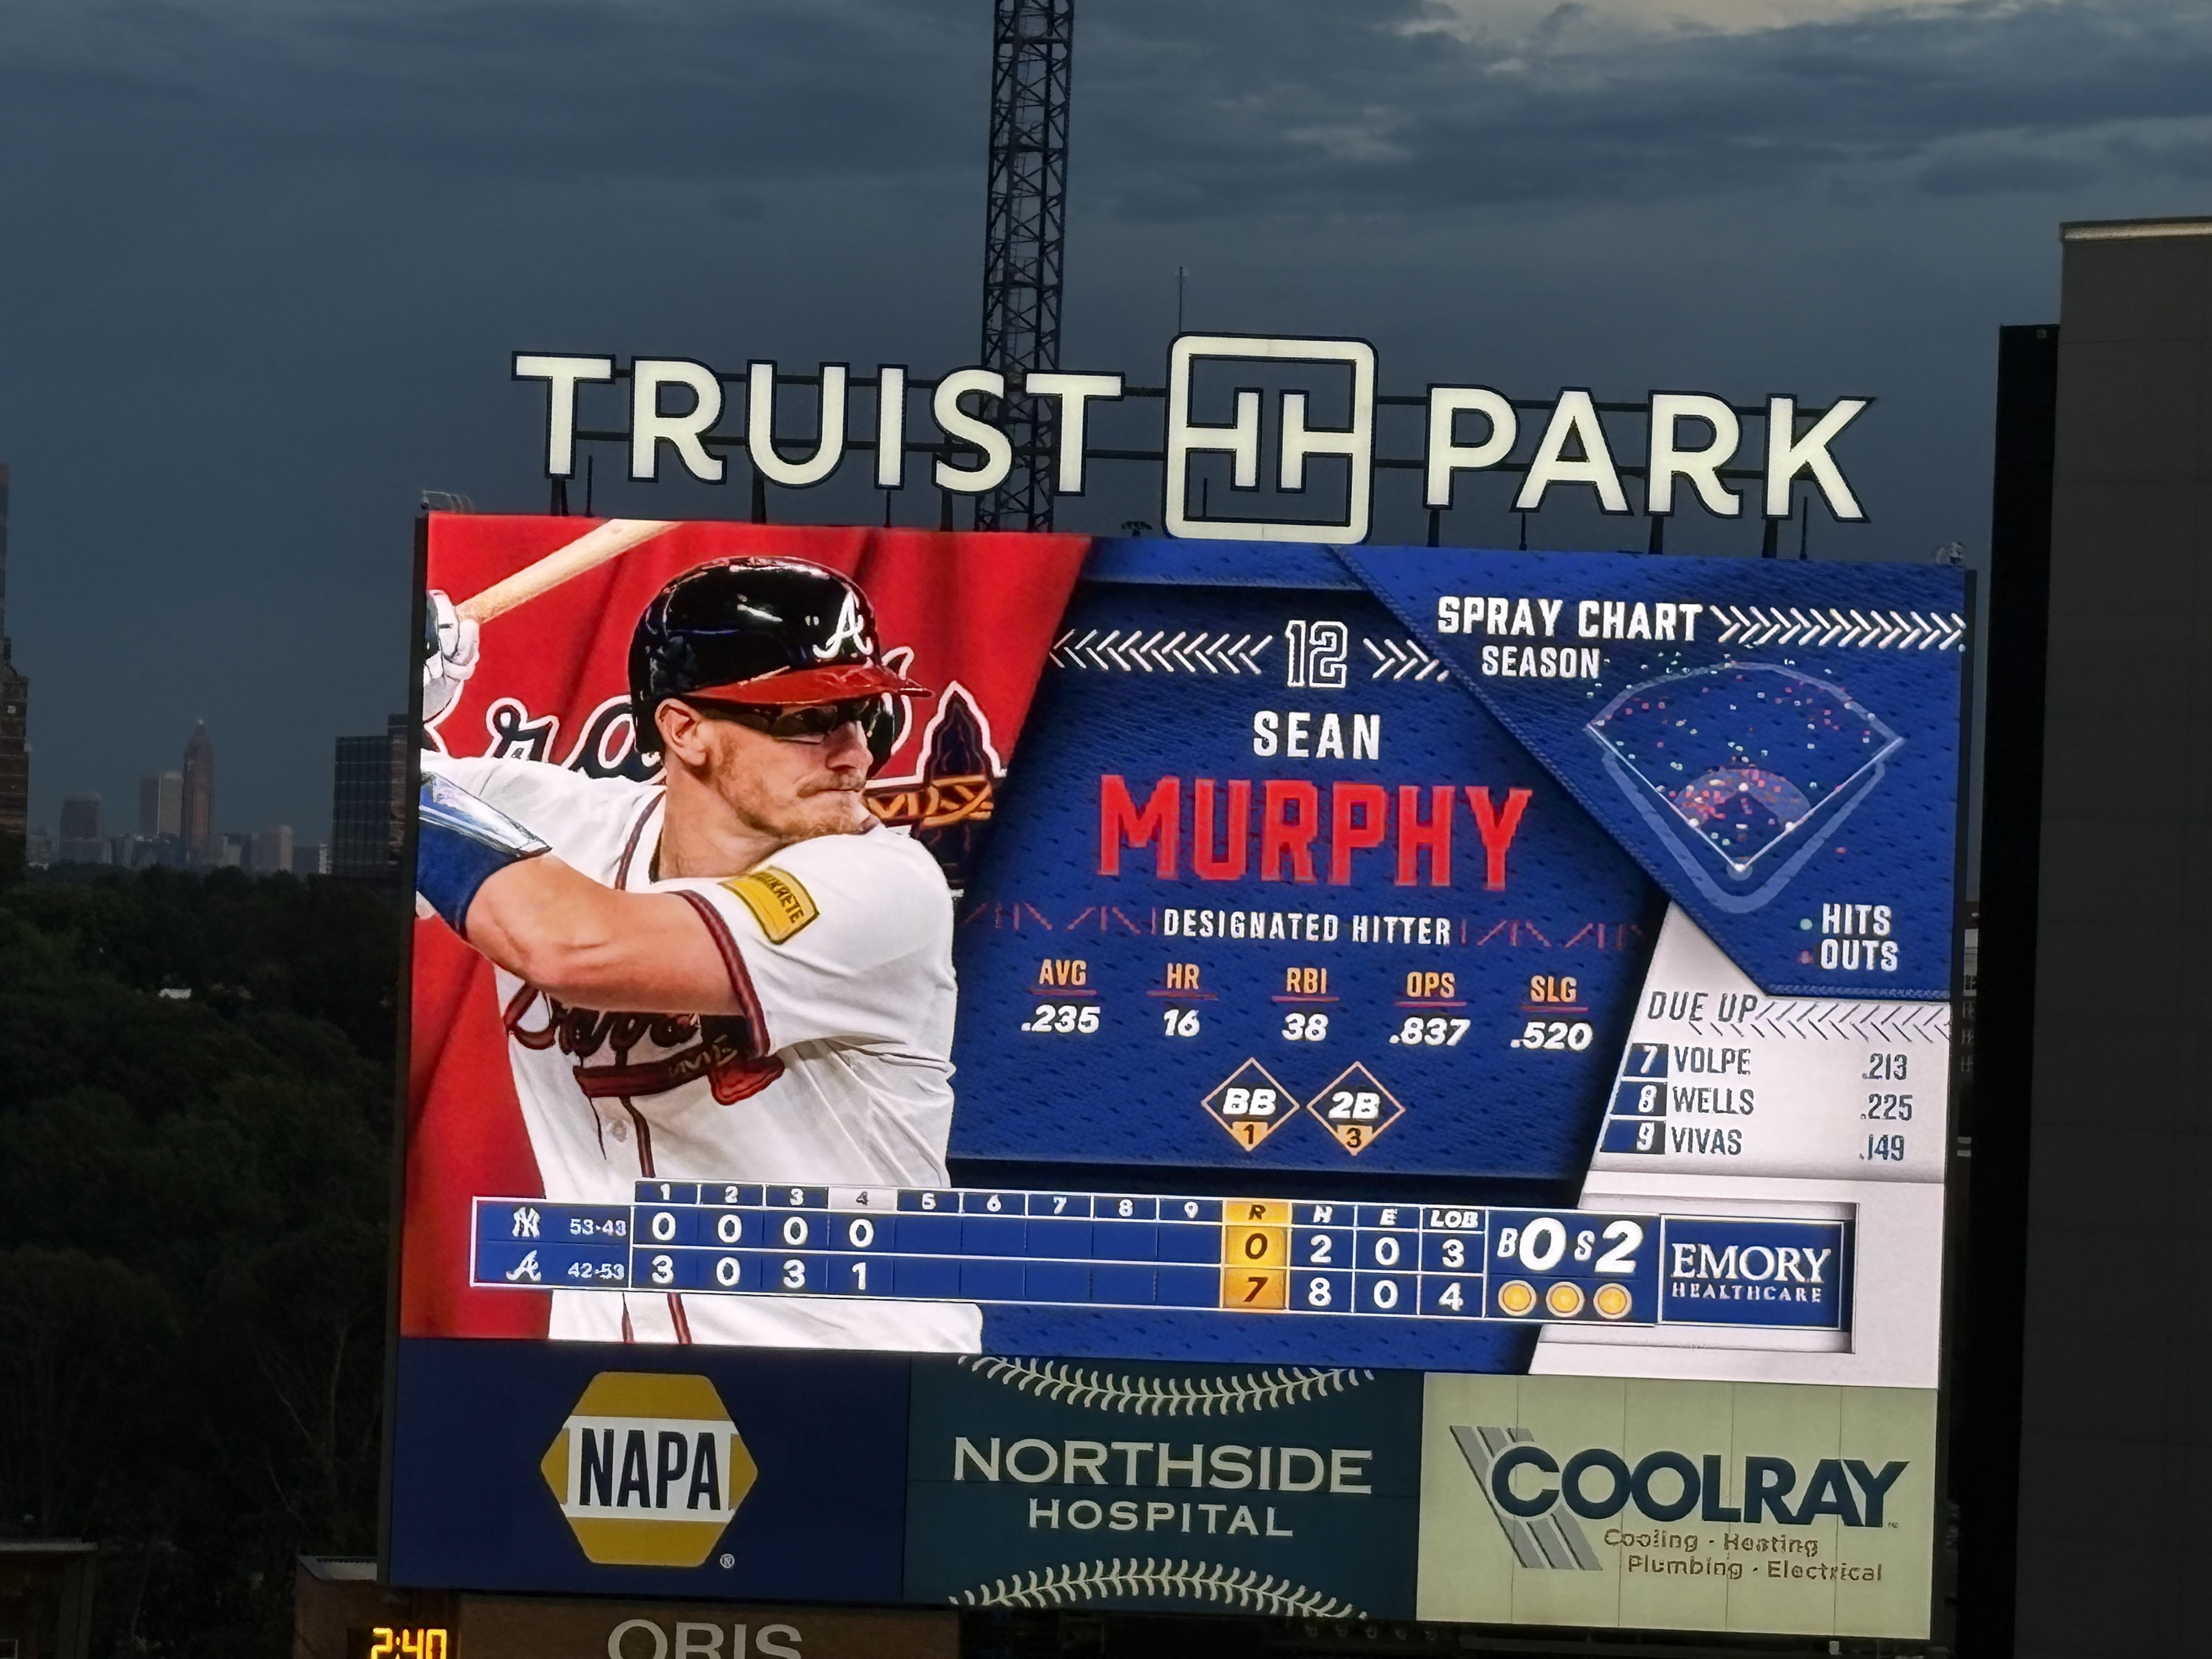
Nick was kind enough to organise a trip to the Braves vs Yankees baseball game, which was super fun. Something that really got to me was the (famously) large amount of stats everywhere, especially on the big screens where new batters were shown with their summary stats (and another similar one for the pitcher).

This got me thinking about how nice it would be to have something like this for infectious disease forecasting models that people could use in their READMEs to summarise performance, or forecast hubs could use as a way of visually summarising a model.

We then had to escape the stadium and naturally, this meant camping in a car park for a bit whilst all the traffic cleared. This gave me some time to think about how these score cards might interact with the kinds of model cards that gen AI has started using. These are basically YAML formats that go in your README that contain model and performance metadata following certain standards.

I naturally then spent a lot of my free day in Atlanta thinking about this whilst zipping up and down the beltline. The conclusion of this is that I think there is a fairly natural way to express this as an extension of scoringutils that outputs both a model card (i.e. YAML) and a scorecard (an image). Claude and I have been iterating on a design document and I am very keen for feedback. Importantly, I am keen to know if there are examples of this kind of thing in the wild, as it’s really a very general and non-domain-specific concept, so it feels like there very much might be.

The score card prototype looks like:

β”Œβ”€β”€β”€β”€β”€β”€β”€β”€β”€β”€β”€β”€β”€β”€β”€β”€β”€β”€β”€β”€β”€β”€β”€β”€β”€β”€β”€β”€β”€β”€β”€β”€β”€β”€β”€β”€β”€β”€β”€β”€β”€β”€β”€β”€β”€β”€β”€β”€β”€β”€β”€β”€β”€β”€β”€β”€β”€β”€β”€β”€β”€β”€β”€β”€β”€β”
β”‚ [Logo]       MODEL NAME              PAR: +2.3%/+1.9% (overall) β”‚ <- Header (Rows 1-3)
β”‚              Team/Organization       Nat: β–β–ƒβ–ˆβ–‚ (1-4w)           β”‚
β”‚                                      Log: β–‚β–„β–ˆβ–ƒ (1-4w)           β”‚
β”œβ”€β”€β”€β”€β”€β”€β”€β”€β”€β”€β”€β”€β”€β”€β”€β”€β”€β”€β”€β”€β”€β”€β”€β”€β”€β”€β”€β”€β”€β”€β”€β”€β”€β”€β”€β”€β”€β”€β”€β”€β”€β”€β”€β”€β”€β”€β”€β”€β”€β”€β”€β”€β”€β”€β”€β”€β”€β”€β”€β”€β”€β”€β”€β”€β”€β”€
β”‚ β”Œβ”€β”€β”€β”€β”€β”€β”€β”€β”€β”€β”¬β”€β”€β”€β”€β”€β”€β”€β”€β”€β”€β”¬β”€β”€β”€β”€β”€β”€β”€β”€β”€β”€β”¬β”€β”€β”€β”€β”€β”€β”€β”€β”€β”€β”¬β”€β”€β”€β”€β”€β”€β”€β”€β”€β”€β”€β”€β”€β”€β”€β”€β”β”‚ <- Metrics (Rows 4-8)
β”‚ β”‚Coverage  β”‚   WIS    β”‚   Rel    β”‚   Bias   β”‚   Ensemble     β”‚β”‚
β”‚ β”‚ 50%: 48%↓│  Nat: 42↑│  Skill   β”‚ -0.02 ↓  β”‚   Contrib      β”‚β”‚
β”‚ β”‚ 90%: 87%↓│  Log:0.38β”‚Nat: 0.95↑│          β”‚ Nat: +3.2%↑    β”‚β”‚
β”‚ β”‚          β”‚          β”‚Log: 0.87↑│          β”‚ Log: +2.8%↑    β”‚β”‚
β”‚ β””β”€β”€β”€β”€β”€β”€β”€β”€β”€β”€β”΄β”€β”€β”€β”€β”€β”€β”€β”€β”€β”€β”΄β”€β”€β”€β”€β”€β”€β”€β”€β”€β”€β”΄β”€β”€β”€β”€β”€β”€β”€β”€β”€β”€β”΄β”€β”€β”€β”€β”€β”€β”€β”€β”€β”€β”€β”€β”€β”€β”€β”€β”˜β”‚
β”œβ”€β”€β”€β”€β”€β”€β”€β”€β”€β”€β”€β”€β”€β”€β”€β”€β”€β”€β”€β”€β”€β”€β”€β”€β”€β”€β”€β”€β”€β”€β”€β”€β”€β”€β”€β”€β”€β”€β”€β”€β”€β”€β”€β”€β”€β”€β”€β”€β”€β”€β”€β”€β”€β”€β”€β”€β”€β”€β”€β”€β”€β”€β”€β”€β”€β”€
β”‚ [Performance Timeline Graph - Model vs Others]                  β”‚ <- Timeline (Rows 9-11)
β”œβ”€β”€β”€β”€β”€β”€β”€β”€β”€β”€β”€β”€β”€β”€β”€β”€β”€β”€β”€β”€β”€β”€β”€β”€β”€β”€β”€β”€β”€β”€β”€β”€β”€β”€β”€β”€β”€β”€β”€β”€β”€β”€β”€β”€β”€β”€β”€β”€β”€β”€β”€β”€β”€β”€β”€β”€β”€β”€β”€β”€β”€β”€β”€β”€β”€β”€
β”‚ Forecasts: 127 | Since: 2023-01 | Target Coverage: 95%         β”‚ <- Footer (Row 12)
β”‚ Best: 2-week ahead | Most consistent Q3 2024                    β”‚
β””β”€β”€β”€β”€β”€β”€β”€β”€β”€β”€β”€β”€β”€β”€β”€β”€β”€β”€β”€β”€β”€β”€β”€β”€β”€β”€β”€β”€β”€β”€β”€β”€β”€β”€β”€β”€β”€β”€β”€β”€β”€β”€β”€β”€β”€β”€β”€β”€β”€β”€β”€β”€β”€β”€β”€β”€β”€β”€β”€β”€β”€β”€β”€β”€β”€β”˜

A concern is that this is meant to be fun and as I have iterated it has become progressively less fun and more information dense. Definitely something to watch for. I think maybe adding the plots and logos will edge this back in the fun direction.

We also had a good chat about the types of stats that are widely used in baseball and the main one I thought was interesting was performance above replacement. This as I understand it is weighing all the actions players take vs the average action as a way of assessing value (I would like a version of this that is weighted to player cost - more on this in a second). There are things like this that we do (i.e. value to an ensemble where you look at ensemble performance with and without your model) but I think nothing quite like it. I think we could get closer if we looked at permutations of models in ensembles (as both @sbfnk and co and Spencer Fox and co have been doing recently). So this would look like taking ensemble performance with our model and dividing by the mean performance of all possible ensembles created by removing our model and instead duplicating another component model. A caveat is I haven’t really thought through how this relates to other measures we already have (i.e. the ensemble with and without, just taking relative skill etc.). A nuance here is you might want to check replacement by some sub strata or categories (i.e. replacement across renewal models etc. but I think except in very large forecasting problems with lots of problems this is likely to run into issues.

If it does shake out as being useful, then as with baseball, I like the idea of trying to normalise against effort. I have had a bugbear for a while at how we confound model performance by modelling effort. All the forecasting I have done points to a relationship between having more time to spend reviewing, iterating and just looking at the forecasts and how you do in evaluations. This should mean that well-resourced teams that focus heavily on forecasting do very well, whilst less resourced teams do less well. There is also some interaction with model complexity as a more complex model takes more time and thus leaves less effort for the other forecasting tasks that might be the thing driving performance. This would bias us towards simpler models (it’s convenient I think this isn’t it). Another way to think about this is an β€œhouse effect” where all models from a team should have some common performance aspects and some that vary.

Something to note is we can also get at this doing model-based evaluation (i.e. adjusting for team size etc.) but this makes us need some fairly complex other ideas so having a good summary measure might be useful.

Summary

For me, the baseball statistics displayed at the game highlighted three gaps in how we evaluate forecasting models:

  • Visual scorecards could make model performance more accessible than current approaches.
  • Performance-above-replacement metrics might better capture model value within ensembles than existing measures.
  • Effort-normalised evaluation could address the confounding between model performance and development resources.
4 Likes

Very cool! I like the prototype score card, informative.

I think maybe adding the plots and logos will edge this back in the fun direction.

And emojis! :laughing: As Claude would likely try to do (based on it’s model submission reports during SISMID). :trophy:
Perhaps even a metadata entry for team colors.

1 Like

Yeah in the spec is the idea a team might have a colour scheme. I think it might be fun to add a hub or other colour scheme (i.e. across models) and a model/team colour scheme as well

I’m excited about this idea!

Noting that Minsu Kim is working on this idea of β€œmodel importance” that is basically an implementation of a version of the β€œscore all the permutations of models” idea. The core ideas are in her recent preprint which was just revised and resubmitted to Intl Journal of Forecasting.

And an R package is in the works too…

I’ve been wondering for a while if we could create more interesting forecasting collaborations if the primary scoring metric was something like this. Instead of β€œmake the best prediction you can” it’s more like β€œmake the best prediction you can that no one else is already making”. Which I guess at an extreme could turn into trying to predict when and how other predictions will fail.

As another example of baseball stats β€œscorecards” check out these umpire ratings that are posted after every game.

Here’s the one from the game on Friday night:

1 Like

Nice! Looking forward to trying out the package.,

I think this doesn’t extend to the replacement component mentioned here though? i.e. its the leave one or a subset out and normalise relative to the ensemble (or take difference) vs here leave one out and replace it with another for all permutations, then take the mean (or not if wanting a range) and use this to normalise the ensemble that includes the target model. The latter is closest, I think to the baseball metric but I haven’t thought deeply on tradeoffs.

Which I guess at an extreme could turn into trying to predict when and how other predictions will fail.

Yes, I agree with the general idea and also with trying to push towards this extreme at least a little.

Oh, very cool. This has more of the information dense vibe that the design prototype has been heading towards.

1 Like

Yes I agree that Minsu’s work is different in the way you describe. Although I might argue that this setup is more appropriate in our setting. In sports, if you don’t play there WILL be a replacement (unless I guess you get a red card in a football match). In ensemble forecasting, the models are β€œunique” and would not necessarily be replaced. So I’d argue that the more β€œtrue-to-life” metric is one that doesn’t replace a model with a generic one but just leaves it out.

1 Like

Hmm I guess the replacement is the alternative baseline model I might submit. The issue you have if you don’t adjust for this you end up conflating the value of a given model with the value of an ensemble just having more random models that represent some error distribution i.e. how many models like analyses.

Also I would lightly push back on the idea that models are β€œunique” as often quite derivative of each other right especially in larger hubs. This replacement idea also I think starts maybe getting at that a bit as it adjusts for model weight in some sense to give the uniqueness value (or lol maybe it doesn’t who knows).

@kath-sherratt and I met today to talk about A basket of baselines - #12 by samabbott as an off shoot of that conversation we thought that it would be really great to write a nice tightly scoped piece on the idea in here to evaluate models by value above replacement.

This would be a remix extension of some of the ideas from @nickreich and cos model importance work (with the extension here being replacement) and showing when it might be needed by looking at different ensemble sizes (under the assumption that as performance asymptotes with the addition of more models so should the difference betwee just looking at leave one out and performance above replacement).

We also thought there was an interesting discussion to be had in terms of what to replace with i.e all other models as a permutation, a baseline (hence the link to the basket of baselines), the ensemble of all other models (we thought this might end up being the same as the all permutation idea). There is a clear extension here to weighted replacements i.e more similar models or the extreme category version of this i.e. models from the same β€œfamily” for now we thought we would leave that to the discussion.

The plan is that we will draw up a short analysis plan over the next week or so and then reach out to interested parties from here to set up a meeting. Keen to hear peoples thoughts.

1 Like

I think once you get into weighting things get much more complicated. (How are the weights computed? if you have a model that is essentially given zero weight because it isn’t valuable, then it doesn’t matter what you replace it with?)

I sometimes have trouble following the Sam’s rambly run-ons… But the idea is that the replacement value could be higher in settings with fewer models?

Excited that you all are thinking about this and happy to be involved in further discussions.

2 Likes

The idea is that ensemble without / ensemble with as a measure of performance is confounded by the size of the original ensemble as it mixes the unique contribution of that model vs the contribution of any model. I expect that as the ensemble size grows, the difference between performance above replacement and performance vs not being present at all will shrink given the assumed existence in an asymptotic relationship between ensemble size and performance.

I think once you get into weighting things get much more complicated.

Yes, I agree. Here, the weighting is slightly different (its about weighting the permutations of the replacement not the overall ensemble) but has similar issues hence doing something simpler, i.e. replacement by models of a similar type vs any model would be an easier thing to look at.

There is also the wider point that for any ensemble with weighting, things get really complicated and we haven’t thought about it at all at this stage. That being said I think you might just weight the replacement by the same amount as the current model as a first pass.

Exciting update - we are taking this on as a full investigation! We’ve drafted a pretty well fleshed out analysis plan to look at value above replacement. We’re planning to test a few different options for the proposed replacement model, and point towards lots of meaty ideas for taking this type of analysis further, in the discussion. See attached.

The team working on this is currently me, Sam, and Seb Funk at LSHTM, and Minsu Kim and Nick at UMass Amherst. All thoughts, feedback, and contributions very welcome - comment here to get involved / stay in the loop.

Next step is to work out the requirement for new code, versus building off Minsu’s existing work. Looking forward to getting this underway!

Ensemble value over replacement.pdf (147.7 KB)

1 Like

Adding the latest update :slight_smile:

Sam and I caught up again on this today. We are generally very limited in capacity this side of the new year. The plan is now to

  • Flesh out the current paper draft [timeline: the next ~2 weeks]
    • Focus is on getting detail into the methods section
    • Some extra limitations in comparison with methods from other fields (eg use of different model value metrics in ML)
  • Reschedule the next team meeting (Minsu, Nick, Seb) [timeline: week of the 24th Nov]
    • As usual, anyone reading this and interested is welcome to join - just drop a message
  • Plan a few days’ hackathon type to implement this [timeline: January]
1 Like

@kath-sherratt and I were chatting a bit about things we could do here and we came up with another direction that I think is really quite (in the American sense!) promising.

So instead of attacking the performance above replacement directly as we have been discussing and then either ending up with an absolute or relative score we could instead think about this as performance added vs adding another model. That formulation is essentially the reverse I think but opens up a very clean implementation/narrative as long as we are happy to have a relative only score based on the point @nickreich made that model importance is just a transformation on the same scale as WIS/the original target. The downside is that the meaning of the score is perhaps not as clear to communicate.

So essentially what we could argue for is that you should calculate model importance to an ensemble, via whatever approach you fancy but probably the LOMO, and adjust this to remove the ensemble size issue. In principle, this leaves us with the same what do we replace with challenge as we currently have but here we can be guided by current practice (this made me think should we use any thing else when we normalise one score by another more generally like the ensemble or other ideas we have had for replacement) and use either a baseline or a pairwise tournament (https://epiforecasts.io/scoringutils/reference/get_pairwise_comparisons.html).

So this would look like either:

Performance above replacement (PAR) = (WIS of ensemble with model - WIS of ensemble without model) / (WIS of ensemble with baseline model - WIS of ensemble without baseline model)

or

PAR = model importance but using pairwise comparison

then that could also be scaled by the baseline as in the normal PC approach.

The main downside to this is that you lose the absolute option and the connection to baseball is a bit less clear (sad) but maybe the latter is avoidable if clearly arguing that comparing different adding in options is equiv to replacing?

TLDR: We could switch our approach to instead calculate model importance for all models and then either divide by i.e. a baseline model importance or do a pairwise tournament of model importance scores. This account for the ensemble size issue and give something like a performance above replacement score still I think.

2 Likes

The current plan is to frame this around this kind of thing where we look at both of these ideas:

  • We think there is a problem measuring model importance as suggested in … as … has shown that ensembles typically improve as ensemble grows up to some …

  • In order to account for this there are two possible approaches. 1. is to modify the MI metric so that it accounts for ensemble size and 2. is to use a relative form of MI where the MI for one model is normalised by the MI from other models which contribute to ensembles of comparable size.

  • Sports analytics/baseball blah blah commonly evaluates the contribution of a player to a team and so may provide useful insights into this problem.

  • One metric WAR which scores the contribution of player relative to a replacement player is particularly appealing.

  • In this paper we adapt these ideas into a modified MI measure, performance above replace (PAR), which compares performance of a given model in an ensemble to the performance of some set of replacements models as well as approaches for directly normalising MI to account for ensemble size using the MI of other ensemble models. We compare model rankings from these approaches to rankings form unmodelled MI in two cases studies…

  • We seek to provide guidance on measures to use for assessing a models contribution to a forecast ensemble…

@seabbs-bot and I did some design work on what a scoringutils style workflow could look like with PAR and model importance support.

@nickreich @kath-sherratt @sbfnk aside from design stuff there is also the question of where this fits with the in dev modelimportance package (are we wedded to calling this thing model importance vs ensemble importance, ensemble contribution etc I find it a bit confusing).

Note that here I have a split off issue for scoring imputation support for scoring utils which I think would be a nice utility to have anyway and maybe useful for some other research questions.

I just skim read: https://www.medrxiv.org/content/medrxiv/early/2026/02/18/2026.02.12.26346156.1.full.pdf

by @jack @mariatang @jonathon.mellor and others which uses a performance above replacement based approach to assess model contribution to an ensemble. They argue that this is justified by a functional ANOVA decomposition (I haven’t found more detail on this yet in the paper but I am reading the ref -_interested in hearing more).

There isn’t a justification in here for why this approach vs the model importance approach of @nickreich, Kim etc I wonder if it is the same justification as we have been following (i.e ensemble size confounding).

As a note I much prefer this being talked about as ensemble contribution vs model contribution as the latter just makes me think to what.

This is all very related to our proposal so perhaps there is an interest in having a chat about this a bit?

Will circle back when I have read it in more detail.

Also @jack the code link 404s: https://github.com/jcken95/subensemble-evaluation.

Update I did some git stalking and this is just a name type.The repo lives here: GitHub - jcken95/sub-ensemble-evaluation: Code supporting the manuscript "Evaluation of short-term multi-target respiratory forecasts over winter 2024-25 in England using sub-ensemble contribution analyses"

Great file name here: sub-ensemble-evaluation/src/R/prj/nowcast/whooping.R at 8591e534fb237654dfe0a11604143a86ceebd7a5 Β· jcken95/sub-ensemble-evaluation Β· GitHub